Weather Report at 15:10 NZST Friday 31 July 2026
Updates every 10 minutes (graphs show last 24hr) |
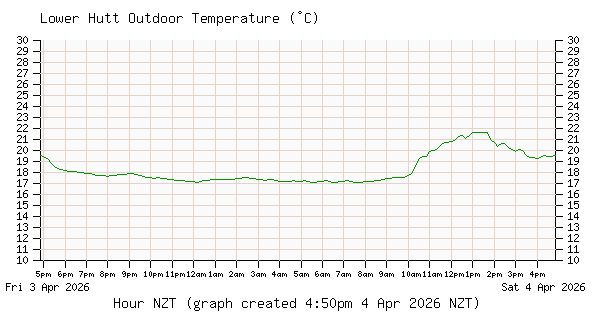
| Outside Temperature |
13°C (56°F) |
graph |
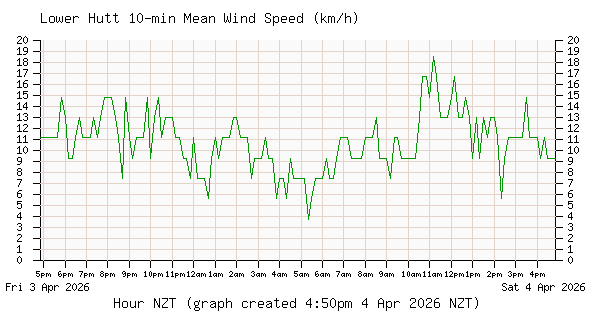
Wind 10 min mean speed |
15 km/hr (8 kt) |
graph |
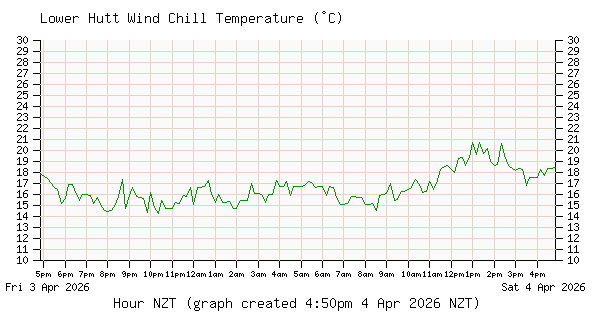
| Wind Chill 10 min mean |
9°C (49°F) |
graph |
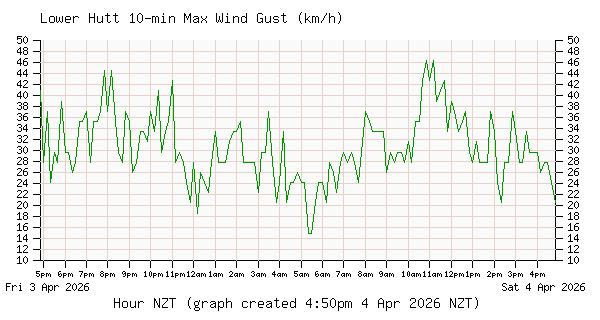
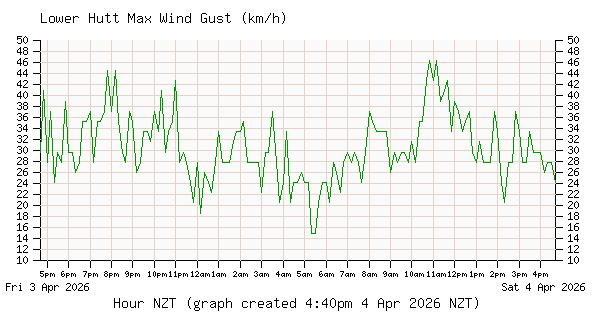
Wind 10 min max gust |
41 km/hr (22 kt) |
graph |
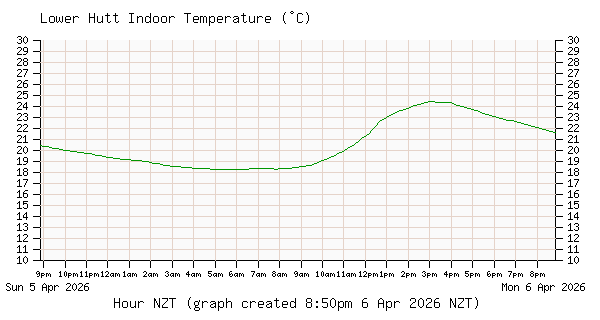
| Inside Temperature |
18°C (64°F) |
graph |
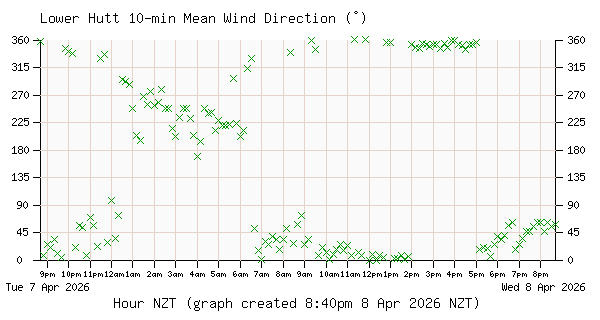
Wind Direction 10 min mean |
NW (313°) |
graph |
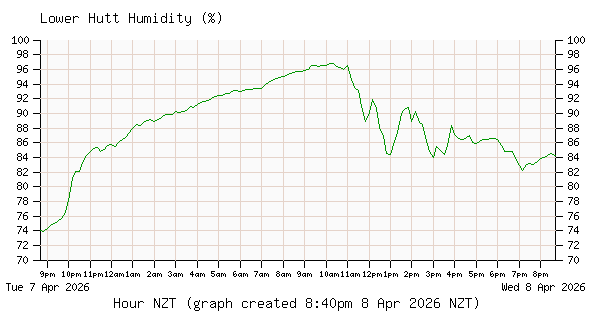
| Humidity |
64% |
graph |
Wind Max Gust last hour |
44 km/hr (24 kt) from NW (325°)
at 15:02 Friday |
graph |
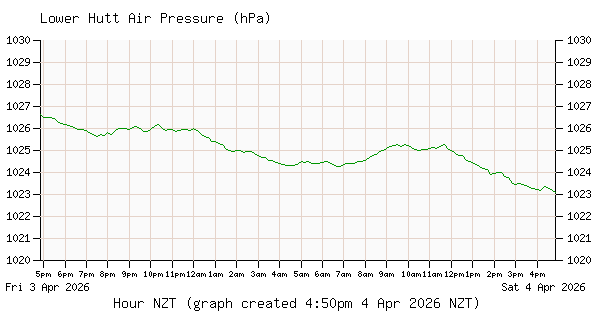
| Air Pressure |
1001 hPa |
graph |
Wind Max Gust last 24 hours |
67 km/hr (36 kt) from NNE (16°)
at 18:41 Thursday |
graph |
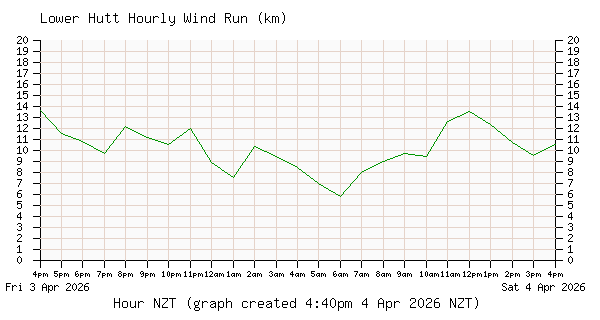
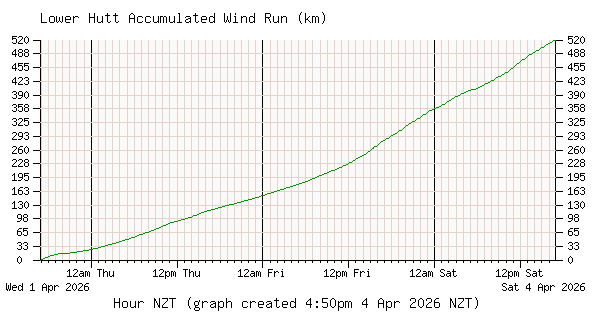
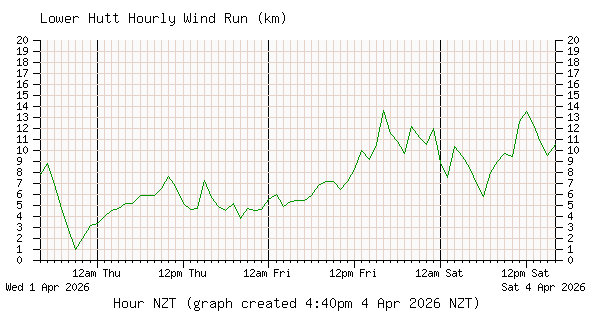
| Wind Run last hour |
11.2 km |
graph |
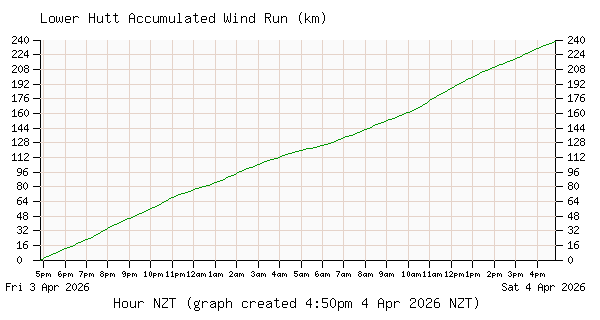
Wind Run last 24 hours |
306.7 km |
graph |
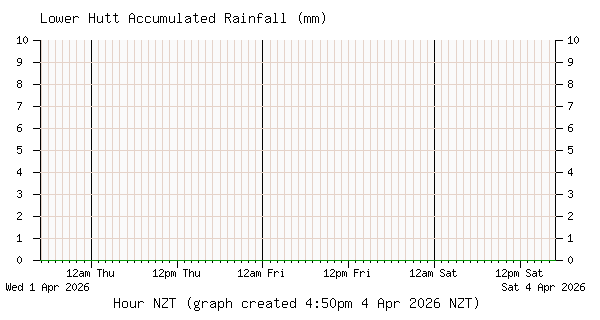
| Rainfall last hour |
0.0 mm |
graph |
Rainfall last 24 hours |
13.2 mm |
graph |
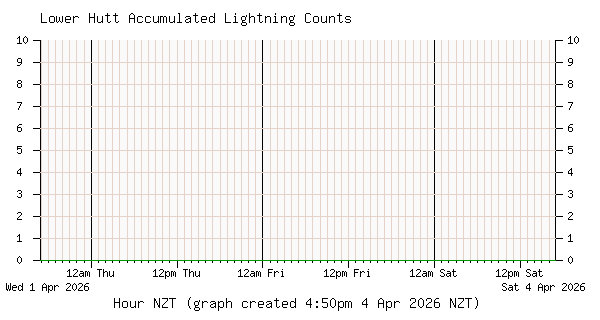
| Lightning counts last hour |
1 |
graph |
Lightning counts last 24 hours |
1 |
graph |
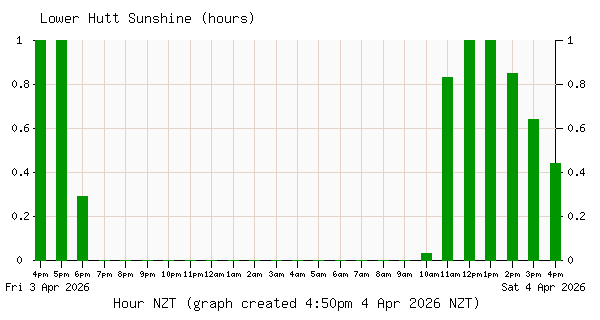
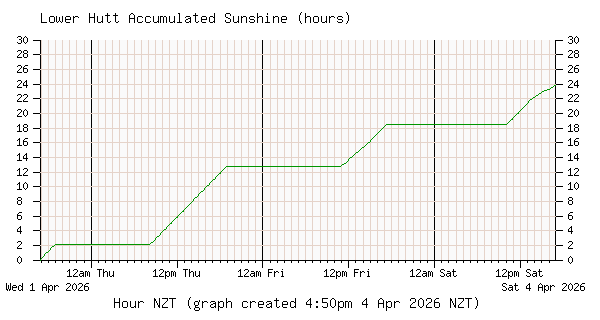
| Sunshine last hour |
1.0 hr |
graph |
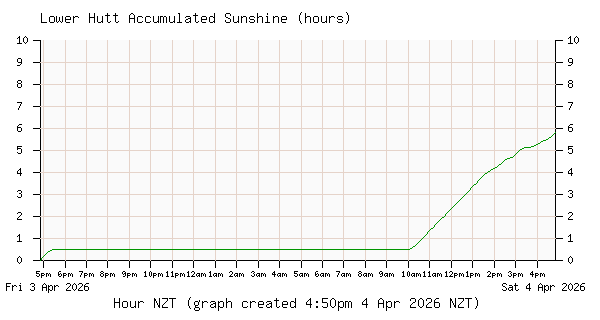
Sunshine today |
6.9 hr |
graph |
